Water Crisis in India 2026: How Saving Water Reduces Your Carbon Footprint
Why Saving Water and Cutting Carbon Are the Same Fight
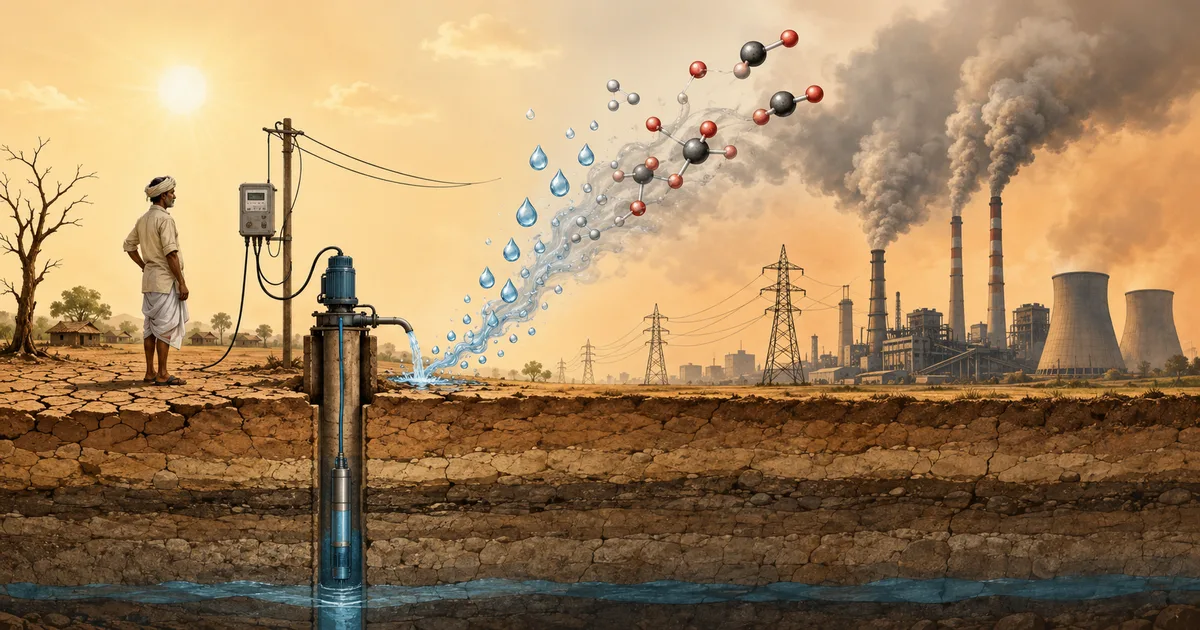
It's May 2026. Temperatures are crossing 45°C across most of India. Tankers are running late. Borewells are going deeper every year. And most people still don't see the connection — wasting water is directly increasing India's carbon emissions.
Here's what nobody tells you: every litre of water flowing from your tap carried a carbon cost to get there. Pumping it from underground, treating it at plants, pushing it through city pipes — all of that burns energy. And in a country where roughly 70% of the electricity grid still runs on thermal (coal and gas) sources, that energy means CO₂ in the atmosphere.
This article breaks down how water waste becomes carbon pollution, why 2026 is an especially critical year, and what you can do about it starting today.
India's Water Situation in 2026: Key Numbers
Before connecting the dots to carbon, here is where India stands on water right now:
| Indicator | Data (2024–2026) | Source |
|---|---|---|
| Annual groundwater extraction | 245.64 billion cubic meters | CGWB / PIB 2024 |
| Stage of groundwater extraction | 60.47% (up from 59.26% in 2023) | CGWB / PIB 2024 |
| El Niño outlook (Dec 2026–Feb 2027) | 96% chance El Niño conditions continue; peak strength uncertain | NOAA CPC |
| IMD monsoon forecast 2026 | ~92% of Long Period Average (below normal most likely) | IMD LRF 2026 |
| Regions at elevated below-normal rainfall risk | Large parts of northwest, central, and western India | IMD outlook |
| Estimated CO₂ from groundwater pumping | 32–131 million tonnes/year | India Water Portal / IIT research |
India extracts more groundwater than the United States and China combined. And the deeper we pump, the more electricity it takes, and the more carbon goes into the sky. It's a crisis hiding inside a crisis.
The Water-Carbon Connection: How Every Litre Carries a Carbon Cost
Water doesn't arrive at your tap for free — it takes energy at every stage:
1. Groundwater Pumping — The Biggest Hidden Emitter
- India operates over 30 million electric and diesel pump sets for groundwater extraction
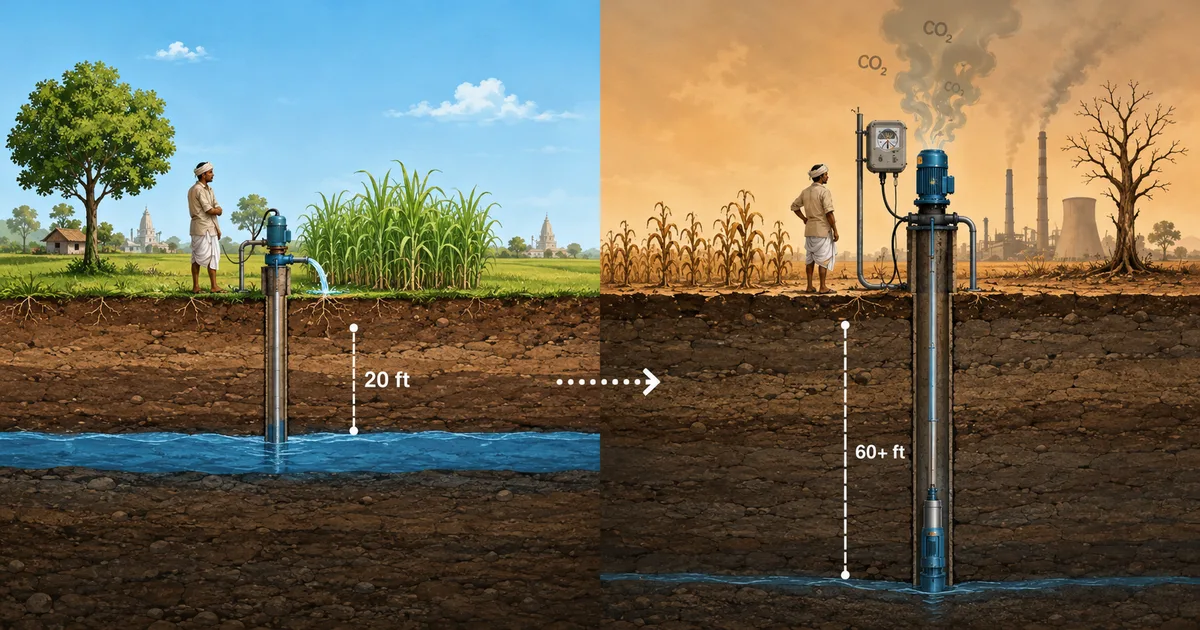
- As aquifers deplete, pumps have to pull from greater depths — every extra metre of depth adds roughly 1.5–3% more energy consumption
- In many parts of Delhi, the water table has receded from about 20 feet two decades ago to well over 60 feet today, meaning significantly more electricity is needed for the same output
- Many agricultural pumps run on subsidized or free electricity, removing any financial incentive to limit extraction
2. City Water Supply — Treatment and Distribution
- Raw water must be pumped from rivers or reservoirs to treatment plants
- Treatment involves filtration, chemical processing, and chlorination — all energy-intensive
- Distribution requires pumping stations to maintain pressure across sprawling urban networks
- Approximate carbon cost: 0.3–0.8 kg CO₂ per 1000 litres of treated water reaching homes
3. Heating Water at Home — The Overlooked Factor
- Electric geyser: roughly 2 kWh for 50 litres = approximately 1.6 kg CO₂ (on India's current grid)
- Gas geyser: approximately 0.8 kg CO₂ for the same 50 litres
- Hot water that goes down the drain unused? That's carbon already emitted with zero utility gained
Your Daily Water Use: The Carbon Hidden Inside
| Water Source / Type | Approx. CO₂ per 1000 Litres | Monthly Impact (Family of 4) |
|---|---|---|
| Shallow groundwater (~30 ft depth) | 0.3–0.5 kg | ~3–5 kg CO₂ |
| Deep borewell (100+ ft) | 1.0–2.0 kg | ~10–20 kg CO₂ |
| Municipal city supply | 0.3–0.8 kg | ~3–8 kg CO₂ |
| Tanker water (diesel-powered) | 2.0–4.0 kg | ~15–30 kg CO₂ |
| RO purifier waste (60% rejection) | +0.5–1.0 kg extra | ~2–4 kg CO₂ added |
| Hot water via electric geyser | 25–35 kg | ~30–50 kg CO₂ |
The takeaway: A typical urban Indian family consuming 10,000+ litres per month generates an estimated 15–60 kg of CO₂ just from water-related energy — without ever thinking about it.
Note: Carbon-saving estimates vary by water source, pump depth, electricity mix, and household use patterns. Values are approximate.
El Niño and India's 2026 Monsoon: Why the Pressure Is Building
According to the NOAA Climate Prediction Center, there is a 96% probability that El Niño conditions will continue through December 2026 to February 2027. However, the final peak strength remains uncertain — no individual strength category currently exceeds 37% probability. Regardless of peak intensity, the implications for India's water supply are clear:
- IMD forecasts below-normal monsoon rainfall at approximately 92% of the Long Period Average (with ±5% model error), as per their 2026 Long Range Forecast
- Large parts of northwest, central, and western India show elevated below-normal rainfall risk during the southwest monsoon season
- Reduced groundwater recharge: Less rain means already-depleted aquifers receive less natural replenishment
- Increased pumping demand: Farmers and cities compensate for surface water shortages by pumping more groundwater, consuming more energy
- Cascading effects: Higher irrigation costs can push food prices up, while increased energy demand adds to emissions
The feedback loop is concerning: Less rain → More pumping → More energy use → Higher emissions → Climate change worsens → Monsoons become more unpredictable. Breaking this cycle requires reducing water demand itself.
10 Practical Steps: Save Water and Cut Carbon Together
🏠 At Home — High Impact
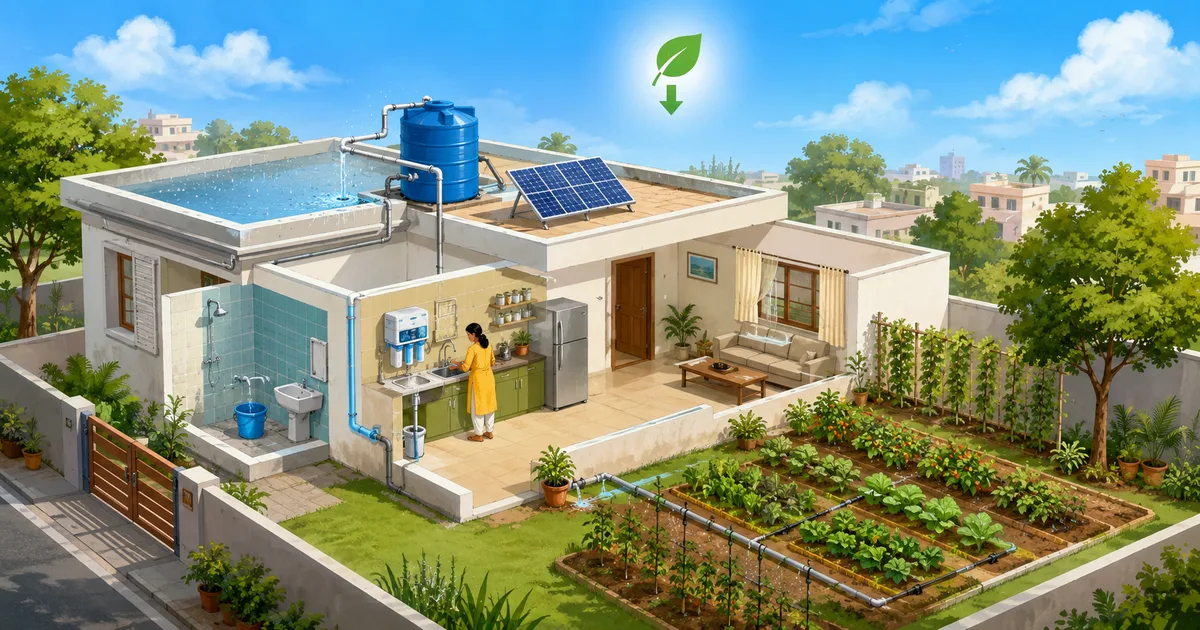
1. Set Up Rainwater Harvesting
A standard 100 sq.m rooftop can collect approximately 50,000–80,000 litres per year with average Indian rainfall — that's several months of household water needs captured for free. Basic systems cost ₹15,000–30,000.
Estimated carbon saved: 25–120 kg CO₂/year by replacing pumped groundwater
2. Reuse RO Reject Water
Standard RO purifiers reject 60–70% of input water. For every 10 litres in, only 3–4 become drinkable. The rejected water is clean enough for mopping, watering plants, car washing, or flushing toilets.
Estimated carbon saved: 15–25 kg CO₂/year
3. Install Low-Flow Taps and Showerheads
Aerator fittings reduce flow by 30–50% without noticeable loss of pressure. They cost ₹200–500 each and start saving water immediately.
Estimated carbon saved: 10–30 kg CO₂/year
4. Switch to Bucket Baths
A 10-minute shower uses 80–100 litres. A bucket bath accomplishes the same with 20–30 litres. When hot water is involved, the carbon difference is significant — you're heating 50–70 fewer litres daily.
Estimated carbon saved: 20–40 kg CO₂/year (more with heated water)
5. Upgrade to Dual-Flush Toilets
Old toilets use 10–13 litres per flush regardless of need. Dual-flush systems offer 3 or 6 litres depending on situation. A family of four can save 40–80 litres every day.
Estimated carbon saved: 15–35 kg CO₂/year
🌱 Garden and Outdoors
6. Switch to Drip Irrigation
Drip systems deliver water directly to roots using 30–50% less water than flood methods. Peer-reviewed research from Indian Punjab demonstrates 23–31% lower CO₂ emissions with drip versus flood irrigation.
Estimated carbon saved: 23–31% reduction per irrigated area
7. Mulch Your Garden
A layer of dry leaves, straw, or coco peat around plants cuts soil evaporation by 25–50%. Plants need watering less often, and the organic matter builds soil health — which itself helps store carbon.
Estimated carbon saved: 5–15 kg CO₂/year + soil carbon storage benefit
🏢 Daily Habits
8. Run Only Full Loads in Your Washing Machine
A half-loaded machine uses nearly as much water as a full one. Consolidating two half-loads into one full load saves 50–80 litres per week, plus the energy required to pump and heat that water.
Estimated carbon saved: 10–20 kg CO₂/year
9. Track Your Water Consumption
What gets measured gets managed. Check your monthly water bill or meter, and use our Carbon Footprint Calculator to understand the CO₂ embedded in your water use. Awareness alone typically drives a 10–15% reduction.
10. Recycle Greywater
Kitchen and bathroom water (with mild soap) can be filtered and redirected to gardens or toilet flushing. Simple household systems cost ₹5,000–15,000 and can recycle 30–50% of daily water output.
Estimated carbon saved: 20–50 kg CO₂/year
How Major Indian Cities Are Affected
| City | Key Water Challenge | Carbon Implication |
|---|---|---|
| Delhi | Rapidly declining water table, polluted Yamuna | Significantly higher pumping energy than two decades ago |
| Bengaluru | Lakes encroached, deep water table in many zones | Among the highest per-litre energy costs in India |
| Chennai | Erratic monsoon, acute summer shortages | Heavy dependence on diesel-powered tankers |
| Hyderabad | Tech corridor driving explosive demand growth | Water-energy footprint growing rapidly |
| Jaipur | Arid climate, limited natural water sources | Long-distance pumping requires substantial energy |
These cities are repeatedly highlighted in water-stress and urban drying analyses. Their growing water demand directly translates to growing energy consumption and carbon output.
India's 30 Million Water Pumps: A Hidden Carbon Source
The scale of this problem is significant:
- 30+ million pump sets operate across India for groundwater extraction
- A study estimated agricultural pumping alone emits 32–131 million tonnes CO₂ every year
- That's roughly 2–5% of India's total national carbon output — just from pulling water from the ground
- Decades of subsidized farm electricity have removed financial incentives to pump less
- As water tables continue falling, emissions rise even without new pumps being added
Research has also shown that severely depleted groundwater zones face compounding carbon problems: stressed vegetation above loses some capacity to absorb CO₂, and disturbed soil conditions can release previously stored carbon. The water-carbon connection runs deeper than just pump energy.
Government Initiatives Already in Progress
- Jal Jeevan Mission: Piped water to every rural household — reducing dependency on individual pumping
- PM-KUSUM: Solar pumps replacing diesel ones — same water output, near-zero carbon
- MGNREGA water structures: Millions of check dams and percolation ponds to boost natural recharge
- National Water Awards 2026: Recognizing innovation in water conservation at all levels
- Atal Bhujal Yojana: Community-led groundwater management in 7 water-stressed states
Water also became a major global policy theme in 2026, with "Year of Water" language appearing around Davos and UN water discussions — signaling growing international attention on the water-climate nexus.
Start Tracking Your Water-Carbon Footprint
Understanding your impact is the first step toward reducing it:
- Use our Carbon Footprint Calculator — see how much CO₂ your water habits contribute
- Create your free HaritKosh account — track water-saving actions and measure your impact over time
- Start one change this week — rainwater collection, RO reuse, or shorter showers
- Learn how water conservation can connect to carbon credits under the Indian Carbon Market
The Bottom Line: Save Water = Reduce Carbon
India's water situation in 2026 is a clear signal. Water and carbon are not separate problems — they're deeply connected. Every litre saved means less pumping energy, fewer emissions, and a lighter load on both aquifers and atmosphere.
- A study estimates groundwater pumping produces 32–131 million tonnes CO₂/year in India
- Household conservation measures can prevent an estimated 100–300 kg CO₂ per family per year
- A rooftop can harvest 50,000–80,000 litres of free water annually
- El Niño conditions and a below-normal monsoon forecast add urgency to act now
Pick one action from this list. Do it today. Measure the result. Then add another. That's how change happens — one drop, one household, one city at a time.
Sources
- NOAA CPC — ENSO Diagnostic Discussion (May 2026)
- IMD — Long Range Forecast for Southwest Monsoon 2026
- CGWB / PIB — Dynamic Groundwater Resources Assessment of India (2024)
- India Water Portal — Groundwater Decline Increases Carbon Emission
- Springer (2024) — Improved Irrigation and Groundwater Management for Reducing CO₂ Emissions, Punjab
- Economic Times — WEF Davos 2026: Year of Water
Disclaimer: Carbon-saving estimates vary by water source, pump depth, electricity mix, and household use patterns. Values presented are approximate and intended as general guidance.
Keep reading: What Is a Carbon Footprint? India 2026 Guide | How EVs Save Carbon in India 2026 | Indian Carbon Market 2026: Portal Launch & Trading
Frequently Asked Questions
Related Articles

Carbon Credits for Beginners: India's Green Economy Explained
Learn what carbon credits are and how they drive India's green economy in 2026. Beginner-friendly...
Green Hydrogen India 2026: Projects, Cost & Carbon Impact
India's green hydrogen landscape in 2026: major projects, production costs, carbon reduction...
How to Plant a Tree in India: Carbon Offset Guide (2026)
Learn how to plant a tree correctly in India: best season, species selection, step-by-step guide,...